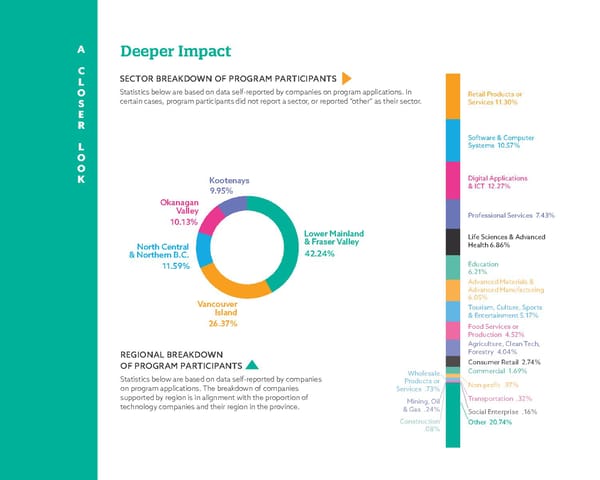
A Deeper Impact C SECTOR BREAKDOWN OF PROGRAM PARTICIPANTS L O Statistics below are based on data self-reported by companies on program applications. In Retail Products or S certain cases, program participants did not report a sector, or reported “other” as their sector. Services 11.30% E R Software & Comuter L Sstems 10.7% O O K Kootenays ‘i†ital licatios €.€ & ’Cƒ 12.27% Okanagan Valley Professioal Services 7.43% ‚. Lower Mainland ife Scieces & dvaced North Central & Fraser Valley ealth .€% & Northern B.C. . .€ ‚ducatio .21% dvaced ˆaterials & dvaced ˆaufacturi† Vancouver .0% Island ƒourism„ Culture„ Sorts & ‚tertaimet .17% . …ood Services or Productio 4.2% †riculture„ Clea ƒech„ REGIONAL BREAKDOWN …orestr 4.04% OF PROGRAM PARTICIPANTS Cosumer Retail 2.74% Œholesale Commercial 1.‡% Statistics below are based on data self-reported by companies Products or ‰oŠrofit .‡7% on program applications. The breakdown of companies Services .73% supported by region is in alignment with the proportion of ˆii†„ Oil ƒrasortatio .32% technology companies and their region in the province. & Žas .24% Social ‚terrise .1% Costructio Other 20.74% .0€%
 Innovate BC 2021 2022 Impact Report Page 9 Page 11