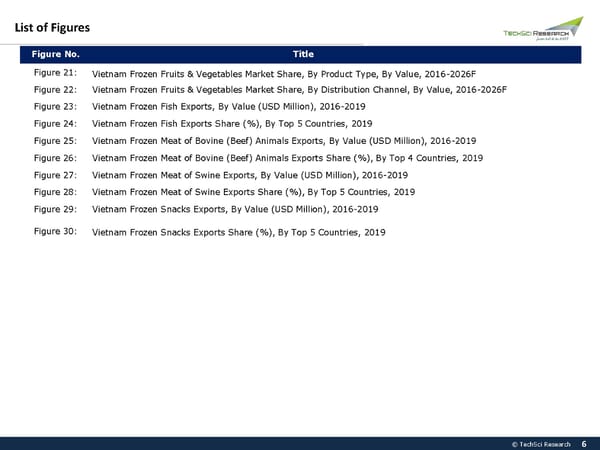
List of Figures Figure No. Title Figure 21: Vietnam Frozen Fruits & Vegetables Market Share, By Product Type, By Value, 2016-2026F Figure 22: Vietnam Frozen Fruits & Vegetables Market Share, By Distribution Channel, By Value, 2016-2026F Figure 23: Vietnam Frozen Fish Exports, By Value (USD Million), 2016-2019 Figure 24: Vietnam Frozen Fish Exports Share (%), By Top 5 Countries, 2019 Figure 25: Vietnam Frozen Meat of Bovine (Beef) Animals Exports, By Value (USD Million), 2016-2019 Figure 26: Vietnam Frozen Meat of Bovine (Beef) Animals Exports Share (%), By Top 4 Countries, 2019 Figure 27: Vietnam Frozen Meat of Swine Exports, By Value (USD Million), 2016-2019 Figure 28: Vietnam Frozen Meat of Swine Exports Share (%), By Top 5 Countries, 2019 Figure 29: Vietnam Frozen Snacks Exports, By Value (USD Million), 2016-2019 Figure 30: Vietnam Frozen Snacks Exports Share (%), By Top 5 Countries, 2019 © TechSci Research 6
 Vietnam Frozen Food Market 2026 Page 5 Page 7