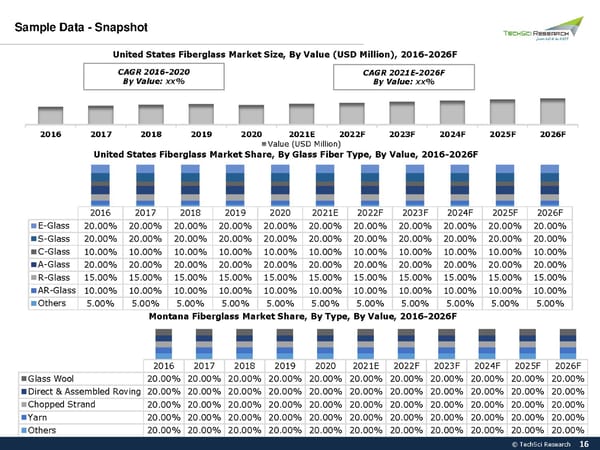
Sample Data - Snapshot United States Fiberglass Market Size, By Value (USD Million), 2016-2026F CAGR 2016-2020 CAGR 2021E-2026F By Value: xx% By Value: xx% 2016 2017 2018 2019 2020 2021E 2022F 2023F 2024F 2025F 2026F Value (USD Million) United States Fiberglass Market Share, By Glass Fiber Type, By Value, 2016-2026F 2016 2017 2018 2019 2020 2021E 2022F 2023F 2024F 2025F 2026F E-Glass 20.00% 20.00% 20.00% 20.00% 20.00% 20.00% 20.00% 20.00% 20.00% 20.00% 20.00% S-Glass 20.00% 20.00% 20.00% 20.00% 20.00% 20.00% 20.00% 20.00% 20.00% 20.00% 20.00% C-Glass 10.00% 10.00% 10.00% 10.00% 10.00% 10.00% 10.00% 10.00% 10.00% 10.00% 10.00% A-Glass 20.00% 20.00% 20.00% 20.00% 20.00% 20.00% 20.00% 20.00% 20.00% 20.00% 20.00% R-Glass 15.00% 15.00% 15.00% 15.00% 15.00% 15.00% 15.00% 15.00% 15.00% 15.00% 15.00% AR-Glass 10.00% 10.00% 10.00% 10.00% 10.00% 10.00% 10.00% 10.00% 10.00% 10.00% 10.00% Others 5.00% 5.00% 5.00% 5.00% 5.00% 5.00% 5.00% 5.00% 5.00% 5.00% 5.00% Montana Fiberglass Market Share, By Type, By Value, 2016-2026F 2016 2017 2018 2019 2020 2021E 2022F 2023F 2024F 2025F 2026F Glass Wool 20.00% 20.00% 20.00% 20.00% 20.00% 20.00% 20.00% 20.00% 20.00% 20.00% 20.00% Direct & Assembled Roving 20.00% 20.00% 20.00% 20.00% 20.00% 20.00% 20.00% 20.00% 20.00% 20.00% 20.00% Chopped Strand 20.00% 20.00% 20.00% 20.00% 20.00% 20.00% 20.00% 20.00% 20.00% 20.00% 20.00% Yarn 20.00% 20.00% 20.00% 20.00% 20.00% 20.00% 20.00% 20.00% 20.00% 20.00% 20.00% Others 20.00% 20.00% 20.00% 20.00% 20.00% 20.00% 20.00% 20.00% 20.00% 20.00% 20.00% © TechSci Research 1616
 United States Fiberglass Market 2026 Page 15 Page 17