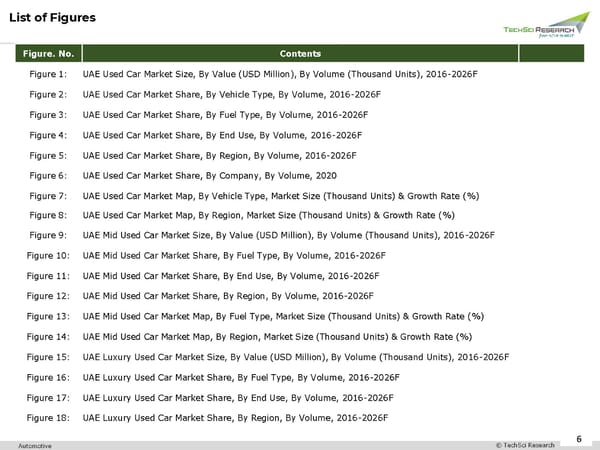
6 6 © TechSci Research Automotive Figure. No. Contents Figure 1: UAE Used Car Market Size, By Value (USD Million), By Volume (Thousand Units), 2016 - 2026F Figure 2: UAE Used Car Market Share, By Vehicle Type, By Volume, 2016 - 2026F Figure 3: UAE Used Car Market Share, By Fuel Type, By Volume, 2016 - 2026F Figure 4: UAE Used Car Market Share, By End Use, By Volume, 2016 - 2026F Figure 5: UAE Used Car Market Share, By Region, By Volume, 2016 - 2026F Figure 6: UAE Used Car Market Share, By Company, By Volume, 2020 Figure 7: UAE Used Car Market Map, By Vehicle Type, Market Size (Thousand Units) & Growth Rate (%) Figure 8: UAE Used Car Market Map, By Region, Market Size (Thousand Units) & Growth Rate (%) Figure 9: UAE Mid Used Car Market Size, By Value (USD Million), By Volume (Thousand Units), 2016 - 2026F Figure 10: UAE Mid Used Car Market Share, By Fuel Type, By Volume, 2016 - 2026F Figure 11: UAE Mid Used Car Market Share, By End Use, By Volume, 2016 - 2026F Figure 12: UAE Mid Used Car Market Share, By Region, By Volume, 2016 - 2026F Figure 13: UAE Mid Used Car Market Map, By Fuel Type, Market Size (Thousand Units) & Growth Rate (%) Figure 14: UAE Mid Used Car Market Map, By Region, Market Size (Thousand Units) & Growth Rate (%) Figure 15: UAE Luxury Used Car Market Size, By Value (USD Million), By Volume (Thousand Units), 2016 - 2026F Figure 16: UAE Luxury Used Car Market Share, By Fuel Type, By Volume, 2016 - 2026F Figure 17: UAE Luxury Used Car Market Share, By End Use, By Volume, 2016 - 2026F Figure 18: UAE Luxury Used Car Market Share, By Region, By Volume, 2016 - 2026F List of Figures
 UAE Used Car Market 2026 Page 5 Page 7