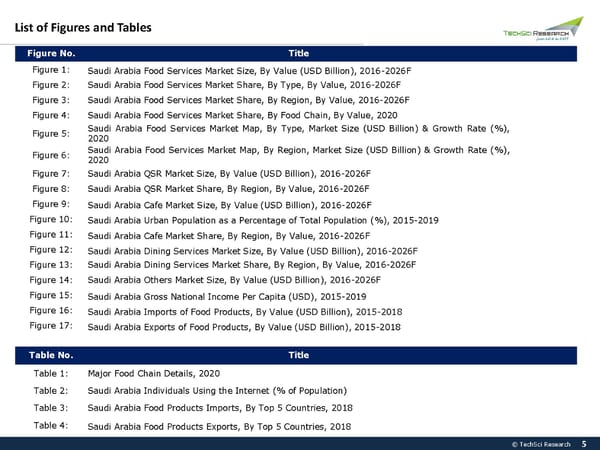
List of Figures and Tables Figure No. Title Figure 1: Saudi Arabia Food Services Market Size, By Value (USD Billion), 2016-2026F Figure 2: Saudi Arabia Food Services Market Share, By Type, By Value, 2016-2026F Figure 3: Saudi Arabia Food Services Market Share, By Region, By Value, 2016-2026F Figure 4: Saudi Arabia Food Services Market Share, By Food Chain, By Value, 2020 Figure 5: Saudi Arabia Food Services Market Map, By Type, Market Size (USD Billion) & Growth Rate (%), 2020 Figure 6: Saudi Arabia Food Services Market Map, By Region, Market Size (USD Billion) & Growth Rate (%), 2020 Figure 7: Saudi Arabia QSR Market Size, By Value (USD Billion), 2016-2026F Figure 8: Saudi Arabia QSR Market Share, By Region, By Value, 2016-2026F Figure 9: Saudi Arabia Cafe Market Size, By Value (USD Billion), 2016-2026F Figure 10: Saudi Arabia Urban Population as a Percentage of Total Population (%), 2015-2019 Figure 11: Saudi Arabia Cafe Market Share, By Region, By Value, 2016-2026F Figure 12: Saudi Arabia Dining Services Market Size, By Value (USD Billion), 2016-2026F Figure 13: Saudi Arabia Dining Services Market Share, By Region, By Value, 2016-2026F Figure 14: Saudi Arabia Others Market Size, By Value (USD Billion), 2016-2026F Figure 15: Saudi Arabia Gross National Income Per Capita (USD), 2015-2019 Figure 16: Saudi Arabia Imports of Food Products, By Value (USD Billion), 2015-2018 Figure 17: Saudi Arabia Exports of Food Products, By Value (USD Billion), 2015-2018 Table No. Title Table 1: Major Food Chain Details, 2020 Table 2: Saudi Arabia Individuals Using the Internet (% of Population) Table 3: Saudi Arabia Food Products Imports, By Top 5 Countries, 2018 Table 4: Saudi Arabia Food Products Exports, By Top 5 Countries, 2018 © TechSci Research 5
 Saudi Arabia Food Services Market 2026 Page 4 Page 6