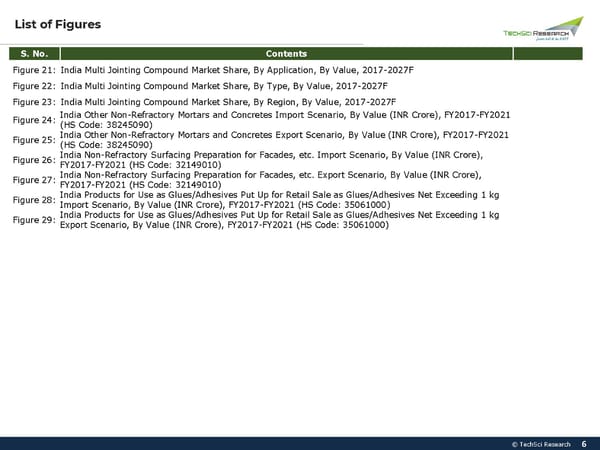
List of Figures S. No. Contents Figure 21: India Multi Jointing Compound Market Share, By Application, By Value, 2017-2027F Figure 22: India Multi Jointing Compound Market Share, By Type, By Value, 2017-2027F Figure 23: India Multi Jointing Compound Market Share, By Region, By Value, 2017-2027F Figure 24: India Other Non-Refractory Mortars and Concretes Import Scenario, By Value (INR Crore), FY2017-FY2021 (HS Code: 38245090) Figure 25: India Other Non-Refractory Mortars and Concretes Export Scenario, By Value (INR Crore), FY2017-FY2021 (HS Code: 38245090) Figure 26: India Non-Refractory Surfacing Preparation for Facades, etc. Import Scenario, By Value (INR Crore), FY2017-FY2021 (HS Code: 32149010) Figure 27: India Non-Refractory Surfacing Preparation for Facades, etc. Export Scenario, By Value (INR Crore), FY2017-FY2021 (HS Code: 32149010) Figure 28: India Products for Use as Glues/Adhesives Put Up for Retail Sale as Glues/Adhesives Net Exceeding 1 kg Import Scenario, By Value (INR Crore), FY2017-FY2021 (HS Code: 35061000) Figure 29: India Products for Use as Glues/Adhesives Put Up for Retail Sale as Glues/Adhesives Net Exceeding 1 kg Export Scenario, By Value (INR Crore), FY2017-FY2021 (HS Code: 35061000) © TechSci Research 66
 India Jointing Compound Market Size 2027 Page 5 Page 7