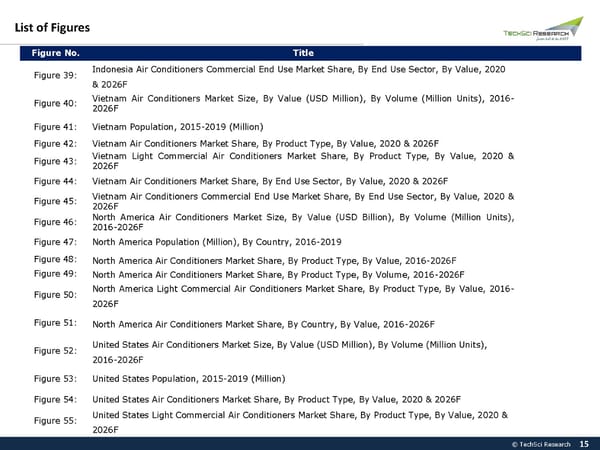
List of Figures Figure No. Title Figure 39: Indonesia Air Conditioners Commercial End Use Market Share, By End Use Sector, By Value, 2020 & 2026F Figure 40: Vietnam Air Conditioners Market Size, By Value (USD Million), By Volume (Million Units), 2016- 2026F Figure 41: Vietnam Population, 2015-2019 (Million) Figure 42: Vietnam Air Conditioners Market Share, By Product Type, By Value, 2020 & 2026F Figure 43: Vietnam Light Commercial Air Conditioners Market Share, By Product Type, By Value, 2020 & 2026F Figure 44: Vietnam Air Conditioners Market Share, By End Use Sector, By Value, 2020 & 2026F Figure 45: Vietnam Air Conditioners Commercial End Use Market Share, By End Use Sector, By Value, 2020 & 2026F Figure 46: North America Air Conditioners Market Size, By Value (USD Billion), By Volume (Million Units), 2016-2026F Figure 47: North America Population (Million), By Country, 2016-2019 Figure 48: North America Air Conditioners Market Share, By Product Type, By Value, 2016-2026F Figure 49: North America Air Conditioners Market Share, By Product Type, By Volume, 2016-2026F Figure 50: North America Light Commercial Air Conditioners Market Share, By Product Type, By Value, 2016- 2026F Figure 51: North America Air Conditioners Market Share, By Country, By Value, 2016-2026F Figure 52: United States Air Conditioners Market Size, By Value (USD Million), By Volume (Million Units), 2016-2026F Figure 53: United States Population, 2015-2019 (Million) Figure 54: United States Air Conditioners Market Share, By Product Type, By Value, 2020 & 2026F Figure 55: United States Light Commercial Air Conditioners Market Share, By Product Type, By Value, 2020 & 2026F © TechSci Research 15
 Global Air Conditioners Market Trend 2026 Page 14 Page 16