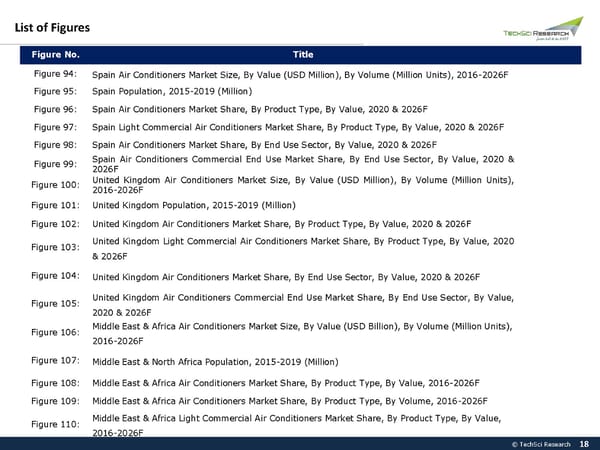
List of Figures Figure No. Title Figure 94: Spain Air Conditioners Market Size, By Value (USD Million), By Volume (Million Units), 2016-2026F Figure 95: Spain Population, 2015-2019 (Million) Figure 96: Spain Air Conditioners Market Share, By Product Type, By Value, 2020 & 2026F Figure 97: Spain Light Commercial Air Conditioners Market Share, By Product Type, By Value, 2020 & 2026F Figure 98: Spain Air Conditioners Market Share, By End Use Sector, By Value, 2020 & 2026F Figure 99: Spain Air Conditioners Commercial End Use Market Share, By End Use Sector, By Value, 2020 & 2026F Figure 100: United Kingdom Air Conditioners Market Size, By Value (USD Million), By Volume (Million Units), 2016-2026F Figure 101: United Kingdom Population, 2015-2019 (Million) Figure 102: United Kingdom Air Conditioners Market Share, By Product Type, By Value, 2020 & 2026F Figure 103: United Kingdom Light Commercial Air Conditioners Market Share, By Product Type, By Value, 2020 &2026F Figure 104: United Kingdom Air Conditioners Market Share, By End Use Sector, By Value, 2020 & 2026F Figure 105: United Kingdom Air Conditioners Commercial End Use Market Share, By End Use Sector, By Value, 2020 & 2026F Figure 106: Middle East & Africa Air Conditioners Market Size, By Value (USD Billion), By Volume (Million Units), 2016-2026F Figure 107: Middle East & North Africa Population, 2015-2019 (Million) Figure 108: Middle East & Africa Air Conditioners Market Share, By Product Type, By Value, 2016-2026F Figure 109: Middle East & Africa Air Conditioners Market Share, By Product Type, By Volume, 2016-2026F Figure 110: Middle East & Africa Light Commercial Air Conditioners Market Share, By Product Type, By Value, 2016-2026F © TechSci Research 18
 Global Air Conditioners Market Trend 2026 Page 17 Page 19