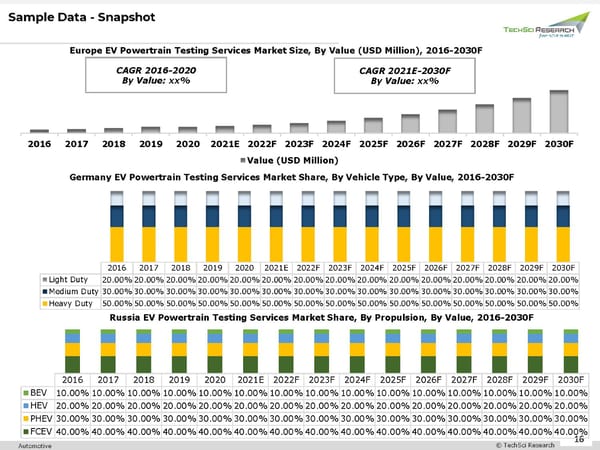
Sample Data -Snapshot Europe EV Powertrain Testing Services Market Size, By Value (USD Million), 2016-2030F CAGR 2016-2020 CAGR 2021E-2030F By Value: xx% By Value: xx% 2016 2017 2018 2019 2020 2021E 2022F 2023F 2024F 2025F 2026F 2027F 2028F 2029F 2030F Value (USD Million) Germany EV Powertrain Testing Services Market Share, By Vehicle Type, By Value, 2016-2030F 2016 2017 2018 2019 2020 2021E 2022F 2023F 2024F 2025F 2026F 2027F 2028F 2029F 2030F Light Duty 20.00%20.00%20.00%20.00%20.00%20.00%20.00%20.00%20.00%20.00%20.00%20.00%20.00%20.00%20.00% Medium Duty 30.00%30.00%30.00%30.00%30.00%30.00%30.00%30.00%30.00%30.00%30.00%30.00%30.00%30.00%30.00% Heavy Duty 50.00%50.00%50.00%50.00%50.00%50.00%50.00%50.00%50.00%50.00%50.00%50.00%50.00%50.00%50.00% Russia EV Powertrain Testing Services Market Share, By Propulsion, By Value, 2016-2030F 2016 2017 2018 2019 2020 2021E 2022F 2023F 2024F 2025F 2026F 2027F 2028F 2029F 2030F BEV 10.00%10.00%10.00%10.00%10.00%10.00%10.00%10.00%10.00%10.00%10.00%10.00%10.00%10.00%10.00% HEV 20.00%20.00%20.00%20.00%20.00%20.00%20.00%20.00%20.00%20.00%20.00%20.00%20.00%20.00%20.00% PHEV 30.00%30.00%30.00%30.00%30.00%30.00%30.00%30.00%30.00%30.00%30.00%30.00%30.00%30.00%30.00% FCEV 40.00%40.00%40.00%40.00%40.00%40.00%40.00%40.00%40.00%40.00%40.00%40.00%40.00%40.00%40.00% 16 Automotive © TechSci Research 16
 Europe EV Powertrain Testing Services Market 2030 Page 15 Page 17