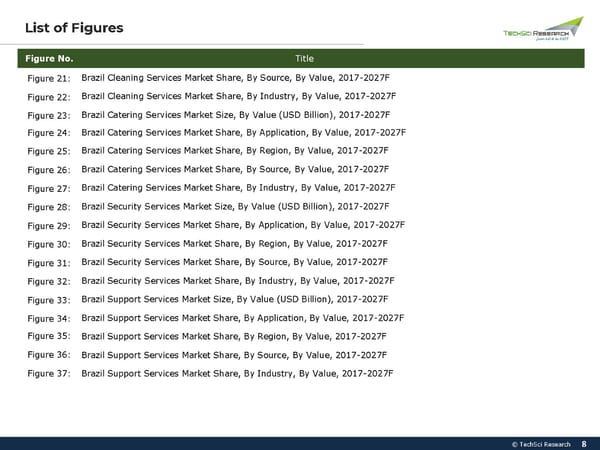
8 © TechSci Research 8 List of Figures Figure No. Title Figure 21: Brazil Cleaning Services Market Share, By Source, By Value, 2017 - 2027F Figure 22: Brazil Cleaning Services Market Share, By Industry, By Value, 2017 - 2027F Figure 23: Brazil Catering Services Market Size, By Value (USD Billion), 2017 - 2027F Figure 24: Brazil Catering Services Market Share, By Application, By Value, 2017 - 2027F Figure 25: Brazil Catering Services Market Share, By Region, By Value, 2017 - 2027F Figure 26: Brazil Catering Services Market Share, By Source, By Value, 2017 - 2027F Figure 27: Brazil Catering Services Market Share, By Industry, By Value, 2017 - 2027F Figure 28: Brazil Security Services Market Size, By Value (USD Billion), 2017 - 2027F Figure 29: Brazil Security Services Market Share, By Application, By Value, 2017 - 2027F Figure 30: Brazil Security Services Market Share, By Region, By Value, 2017 - 2027F Figure 31: Brazil Security Services Market Share, By Source, By Value, 2017 - 2027F Figure 32: Brazil Security Services Market Share, By Industry, By Value, 2017 - 2027F Figure 33: Brazil Support Services Market Size, By Value (USD Billion), 2017 - 2027F Figure 34: Brazil Support Services Market Share, By Application, By Value, 2017 - 2027F Figure 35: Brazil Support Services Market Share, By Region, By Value, 2017 - 2027F Figure 36: Brazil Support Services Market Share, By Source, By Value, 2017 - 2027F Figure 37: Brazil Support Services Market Share, By Industry, By Value, 2017 - 2027F
 Brazil Facility Management Market 2027 Page 7 Page 9