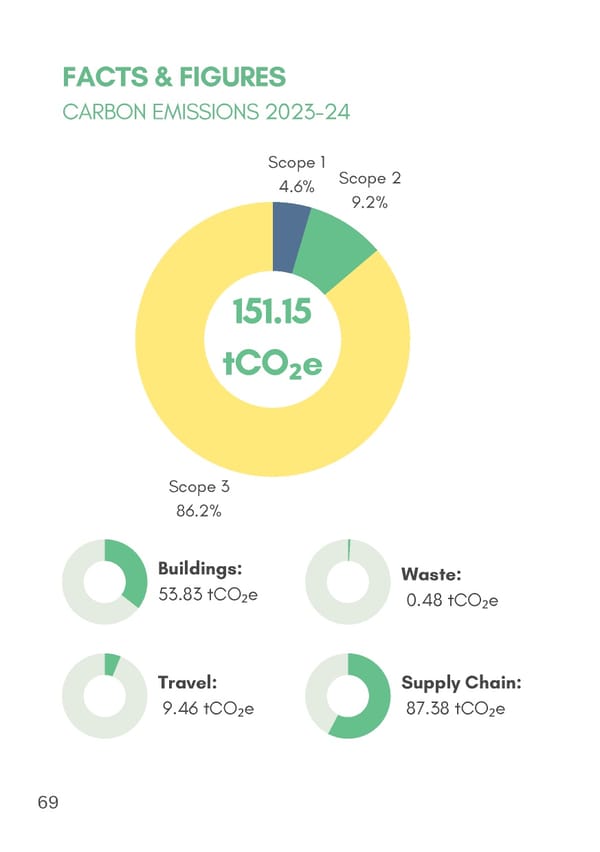
FACTS & FIGURES CARBON EMISSIONS 2023-24 Scope 1 Scope 2 4.6% 9.2% 151.15 tCO₂e Scope 3 86.2% Buildings: Waste: 53.83 tCO₂e 0.48 tCO₂e Travel: Supply Chain: 9.46 tCO₂e 87.38 tCO₂e 69
 IMPACT REPORT 2024 Future Leap compressed Page 69 Page 71
FACTS & FIGURES CARBON EMISSIONS 2023-24 Scope 1 Scope 2 4.6% 9.2% 151.15 tCO₂e Scope 3 86.2% Buildings: Waste: 53.83 tCO₂e 0.48 tCO₂e Travel: Supply Chain: 9.46 tCO₂e 87.38 tCO₂e 69
 IMPACT REPORT 2024 Future Leap compressed Page 69 Page 71