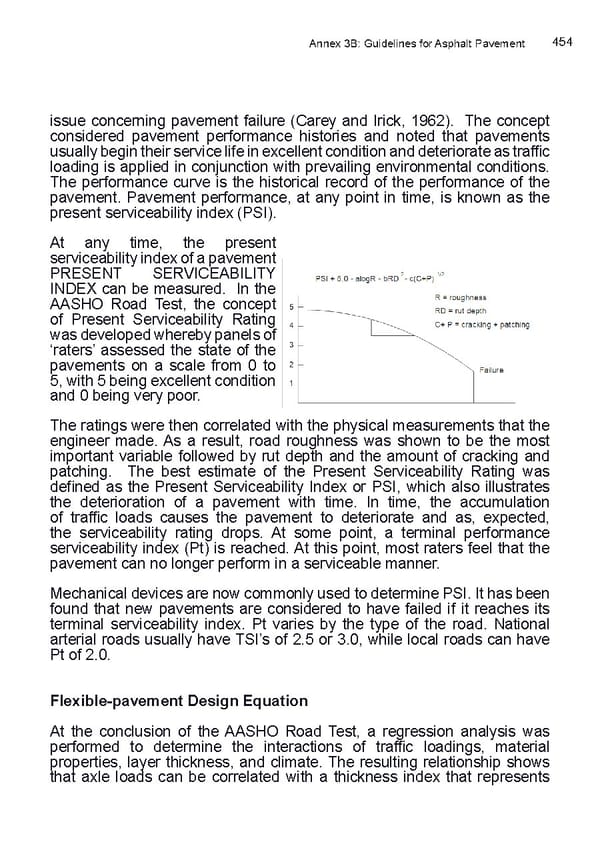
Annex 3B: Guidelines for Asphalt Pavement 454 issue concerning pavement failure (Carey and Irick, 1962). The concept considered pavement performance histories and noted that pavements usually begin their service life in excellent condition and deteriorate as traiffc loading is applied in conjunction with prevailing environmental conditions. The performance curve is the historical record of the performance of the pavement. Pavement performance, at any point in time, is known as the present serviceability index (PSI). At any time, the present serviceability index of a pavement PRESENT SERVICEABILITY INDEX can be measured. In the AASHO Road Test, the concept of Present Serviceability Rating was developed whereby panels of ‘raters’ assessed the state of the pavements on a scale from 0 to 5, with 5 being excellent condition and 0 being very poor. The ratings were then correlated with the physical measurements that the engineer made. As a result, road roughness was shown to be the most important variable followed by rut depth and the amount of cracking and patching. The best estimate of the Present Serviceability Rating was deifned as the Present Serviceability Index or PSI, which also illustrates the deterioration of a pavement with time. In time, the accumulation of traiffc loads causes the pavement to deteriorate and as, expected, the serviceability rating drops. At some point, a terminal performance serviceability index (Pt) is reached. At this point, most raters feel that the pavement can no longer perform in a serviceable manner. Mechanical devices are now commonly used to determine PSI. It has been found that new pavements are considered to have failed if it reaches its terminal serviceability index. Pt varies by the type of the road. National arterial roads usually have TSI’s of 2.5 or 3.0, while local roads can have Pt of 2.0. Flexible-pavement Design Equation At the conclusion of the AASHO Road Test, a regression analysis was performed to determine the interactions of traiffc loadings, material properties, layer thickness, and climate. The resulting relationship shows that axle loads can be correlated with a thickness index that represents
 LRM Manual CMGP Page 453 Page 455